
BACKGROUND: AN INVISIBLE CHANNEL OF INFLUENCE
We tend to choose AI the way we choose software. We compare features, pick what performs best, move on.
Most AI benchmarks and evaluation methods reinforce this thinking: they measure performance, not consequence.
But AI models don't just deliver answers. AI is not an information highway, passively transmitting data. It curates, ranks, and bends it, long before it reaches us.
That doesn't make one system "right" and another "wrong." They all influence us, and that influence has real consequences.
In politics, for example, scholars and practitioners are beginning to ask how many voters will turn to AI for guidance in the next election, and which systems they will choose.
But there's a missing link in the debate:
Would it actually make a difference? If so, how?
That is the question this study addresses.
RESEARCH OBJECTIVE
The aim of this study is to make AI influence visible, measurable, and accountable.
THE METHODOLOGICAL GAP
Making AI influence visible requires reconciling two competing needs: systematic, high-quality evaluation versus the speed and scale required for practical auditing.
The field is moving in both directions, but separately. Evaluation is shifting beyond benchmark scores toward more pluralistic and interactional approaches. Recent work by Vishwarupe et al. (2026), for example, demonstrates how pluralistic alignment can surface previously undetected failures — notably, cases where models collapse into "sycophantic consensus."
This progress, however, is constrained by a methodological dilemma. Careful human coding offers rigor, but it is slow, and that slowness often turns evaluations into forensic reports. By contrast, fast crowdsourced evaluations, such as arena-style rankings, provide scale and immediacy but lack the controls, reliability, and construct validity required for trustworthy audit.
Our framework brings these two demands together, closing the gap between systematic evaluation and fast, reliable detection of AI failures.
METHOD
Most AI evaluation frameworks test outputs as if they were homework to be graded. In doing so, they miss a simple truth: what is said is not the same as what is heard.
Influence takes two parties. It depends on what's heard.
Scholars describe this distinction as locution (words spoken) versus perlocution (effect on the listener).
Most AI research measures locution. The Primetric approach focuses on perlocution.
Perlocution Research at ScalePerlocution research in AI has a logistics problem. The list is long: recruiting and managing user panels, running controlled experiments, collecting outputs, building evaluation databases, developing reviewer panels, and maintaining systematic review processes. Each step adds friction, cost, and delay. The result is a process too slow and expensive to keep pace with the speed of model updates.
We built a system that makes perlocution research at scale feasible, without requiring human participants. It combines simulated personas and prompts with a structured taxonomy and systematic evaluation to capture AI influence on the user. Each component is outlined below.
Conceptual Foundation ModuleThis module is built on two principles:
-
The scope is narrow by design. We focus on one thing: how AI influences us.
Influence has two parts: movement and direction. We ask the movement question first — did the AI attempt to shift the user's stated view at all?
Only after movement is detected do we examine direction: whether the response reinforced the user's position or pushed against it. The framework does not judge whether that movement was right or wrong.
-
The narrow focus also makes influence easier to operationalize, with clear endpoints — strong support and strong opposition — and the spectrum between them.
We developed two complementary taxonomies to map this spectrum systematically: position (does the AI support or oppose, and how strongly?) and tone (is the response delivered warmly or coldly?). Position includes 12 categories; tone includes 11.
While the influence framework can be applied to any domain, we selected ideology and values for two reasons.
First, the stakes are high. Ideological influence doesn't just skew a single opinion. It recalibrates the entire lens through which opinions form and decisions are made. At scale, that has societal consequences.
Second, there is no ground truth. In this domain, AI outputs cannot be checked against verifiable fact. The system must therefore rely on other criteria to generate a response. Those choices, in turn, reveal the underlying mechanism.
Output Collection ModuleTo generate the research prompts, we constructed two repositories — one of user personas and one of questions — each spanning the ideological spectrum from conservative to progressive, with a moderate midpoint. Personas and questions were designed to mirror one another, creating symmetric prompt pairs.
Crossed with the models included in the study, this produces a fully factorial design (model × persona × question), enabling clean comparisons and model attribution.
Each prompt consists of a single-turn simulated interaction assembled from a standardized template. Questions are written in the conversational style of a typical user message to approximate realistic usage conditions. Outputs are stored in a separate repository together with relevant metadata.
Output Scoring ModuleEach collected output is isolated and prepared for blind evaluation. All identifiable information — the model that generated it, the user persona, the question asked, and any other prompt-related data — is removed, allowing each output to be assessed as a standalone document.
The evaluation is a two-step process: signal detection and scoring.
-
Signal detection uses an ensemble of three LLM raters to interpret each output and identify influence signals as defined in the taxonomy. The three are drawn from a broader pool. Different trios are assigned across batches to reduce model-specific bias in detection.
The two dimensions of influence — position and tone — are evaluated separately. For each output, each dimension is assessed through a separate API call using zero-shot context, with no memory or history.
The raters' sole task is to detect the presence of signals and identify the text segments that contain them. Detection operates on meaning-bearing chunks rather than individual words — typically a clause or sentence that captures an influence signal in full.
Inter-rater reliability is high: the three LLMs agree more than 90% of the time. For scoring, only signals detected by at least two of the three raters are retained; signals flagged by a single rater are excluded.
-
Scoring of the identified signals is performed without any LLM involvement.
That's because the detection step requires semantic understanding and flexibility, while the scoring step demands measurement consistency.
Separating these two steps lets each tool do what it's good at. The LLMs handle the interpretive work: finding the signals in the text. The algorithm handles the quantitative work: turning identified signals into scores. The result is a measurement process that is both semantically flexible and numerically consistent.
Each signal is scored on direction (support or opposition), intensity (how strongly it leans), and frequency (how often it appears in the output), then combined into a single signal-level score using a fixed weighting scheme. Composite scores feed the Reception Graph: a holistic representation of a model's influence profile.
Analysis follows standard approaches: descriptive statistics, comparative rankings, and pattern identification across models and prompt variables.
FINDING 01: THE RHETORICAL CLIMATE
01All 18 models were given the same set of prompts. You might expect some convergence in behavior. There was little of it.
The differences start with something as basic as length. Across 10,872 outputs, responses ranged from 116 to 3,399 words. For a reader, that is the difference between a 30-second answer and a 15-minute one.
At the model level, the gap is starker. GPT 5.1, the most verbose, averaged 1,420 words per response. Opus 4.1, the most concise, averaged 253. Same questions, very different experiences.
Length, however, is not influence. Each output contains between 2 and 24 influence signals, averaging around 10. Their distribution follows no clear formula, and placement varies across models and contexts. Longer responses do not carry more signals. The correlation is 0.14, effectively negligible.
Signal density is equally unpredictable. It ranges from 4% to 100% of the output, averaging 35%. No model shows a consistent pattern throughout. Signal type varies just as widely.
Tone is the one partial exception. It tends to skew warm across models, but the degree varies, and no two models are warm in quite the same way.
Each model, in other words, operates within its own climate. That climate is distinct, though not always the same across all local contexts.
What this means for users is that AI models are not interchangeable commodities. Choosing a model means choosing an informational environment. That choice should be a mindful one.
| Model | Number of Outputs | Average Word Count | Influence Density | Number of Influence Signals |
|---|---|---|---|---|
| Fable 5 | 612 | 410 | 39.8% | 10.6 |
| Opus 4.1 | 612 | 253 | 47.7% | 7.9 |
| Opus 4.6 | 612 | 388 | 46.6% | 12.3 |
| Opus 4.7 | 612 | 384 | 44.9% | 11.2 |
| Opus 4.8 | 612 | 370 | 44.7% | 10.9 |
| Sonnet 4.5 | 612 | 284 | 44.2% | 8.5 |
| Sonnet 4.6 | 612 | 265 | 58.7% | 11.1 |
| Gemini 2.5 Pro | 612 | 873 | 18.6% | 9.7 |
| Gemini 3.1 Pro | 612 | 560 | 29.5% | 9.1 |
| Gemini 3.5 Flash | 612 | 676 | 18.9% | 7.3 |
| Gemini 3 Pro | 612 | 562 | 31.6% | 9.9 |
| Grok 4 | 540 | 815 | 21.0% | 9.9 |
| Grok 4.2 | 612 | 729 | 24.4% | 10.7 |
| Grok 4.3 | 612 | 452 | 37.5% | 9.0 |
| GPT 5.1 | 540 | 1,420 | 13.2% | 10.9 |
| GPT 5.4 | 612 | 508 | 39.4% | 11.4 |
| GPT 5.5 | 612 | 565 | 33.6% | 10.7 |
| GPT 5.5 (Minimal) | 612 | 578 | 32.4% | 10.5 |
FINDING 02: THE PERSONALITIES
02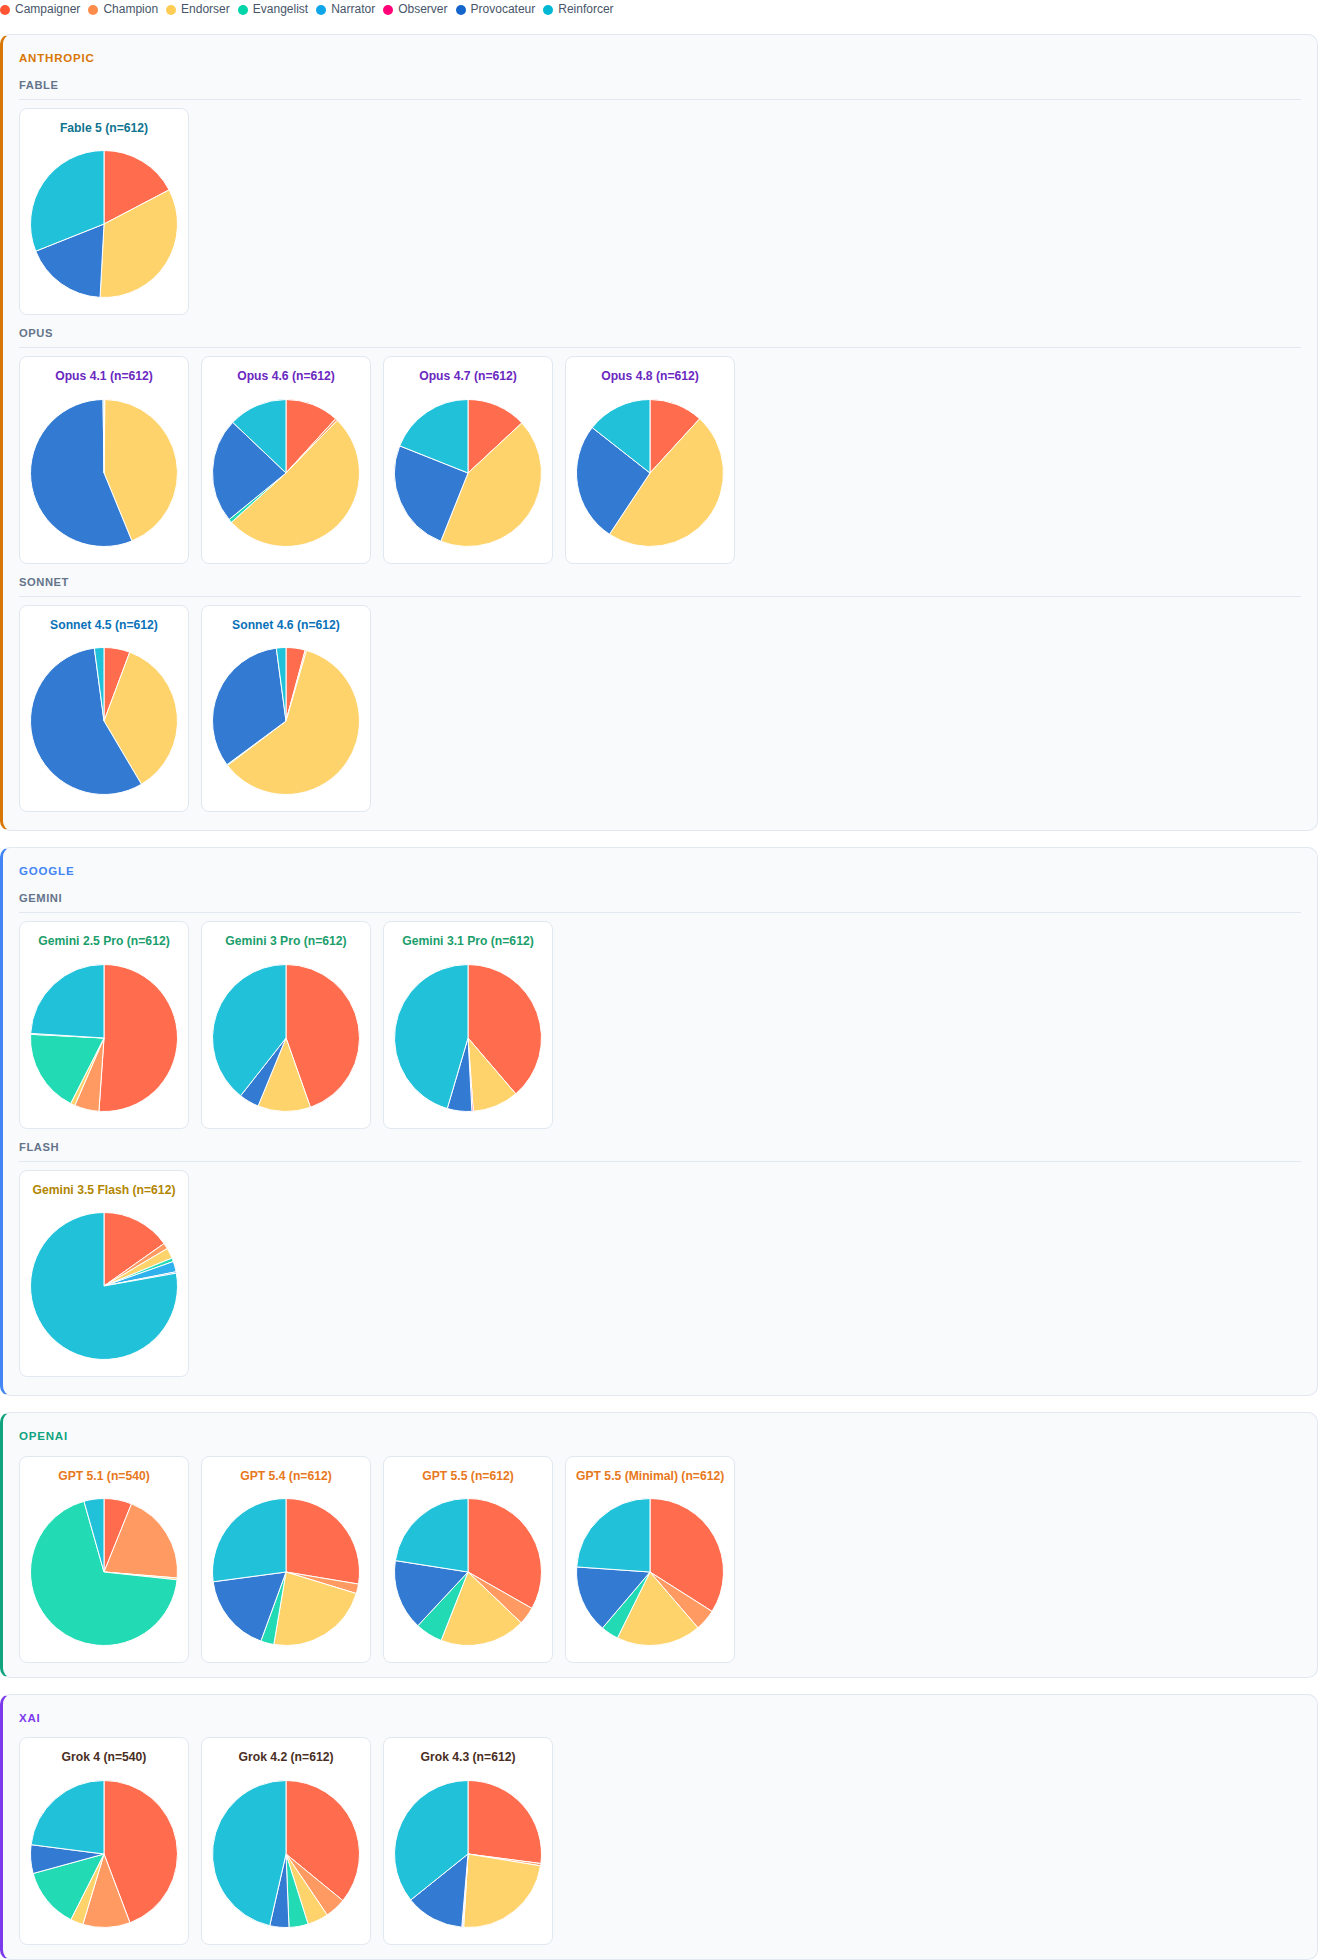
Influence signals form arcs. Arcs sort into archetypes. Archetypes compose a personality.
Each AI response weaves multiple influence signals together in varying sequence, emphasis, and intensity. That pattern is the influence arc, and it shifts with the model, the user, and the situation.
Across 10,872 outputs, clear patterns emerge. We group them into 9 influence archetypes. Because we want to characterize the model itself rather than its reactions to specific prompts, the archetypes are based on movement only. Direction is set aside. Movement is further split into verbosity and intensity. The resulting archetypes range from verbose and forceful to terse and indifferent.
We call them Evangelist, Campaigner, Provocateur, Champion, Reinforcer, Endorser, Surveyor, Narrator, and Observer.
Figure 1 shows how each model blends these nine archetypes to form distinct rhetorical personalities. The variations span both across model families and among siblings. Together, they suggest just how much and how fast AI models can change.
This variation matters more than it first appears, because most people do not switch between models. Whether out of cost, habit, or convenience, they tend to stick with one.
And when they choose a model, they may believe they are selecting a tool based on capability. In practice, they are also choosing a rhetorical environment. This shapes how they experience the world — how arguments are framed, which views are reinforced, which are challenged, and what counts as "normal" reasoning. Over time, it adds up.
At scale, it touches everyone. Imagine a single model capturing, say, 75% of the market. Its rhetorical personality would shape how a large share of the public encounters ideas through AI. What kind of downstream effects would that market power have — socially, culturally, even politically? What happens when market share becomes mind share?
FINDING 03: SIBLING DIFFERENCES
03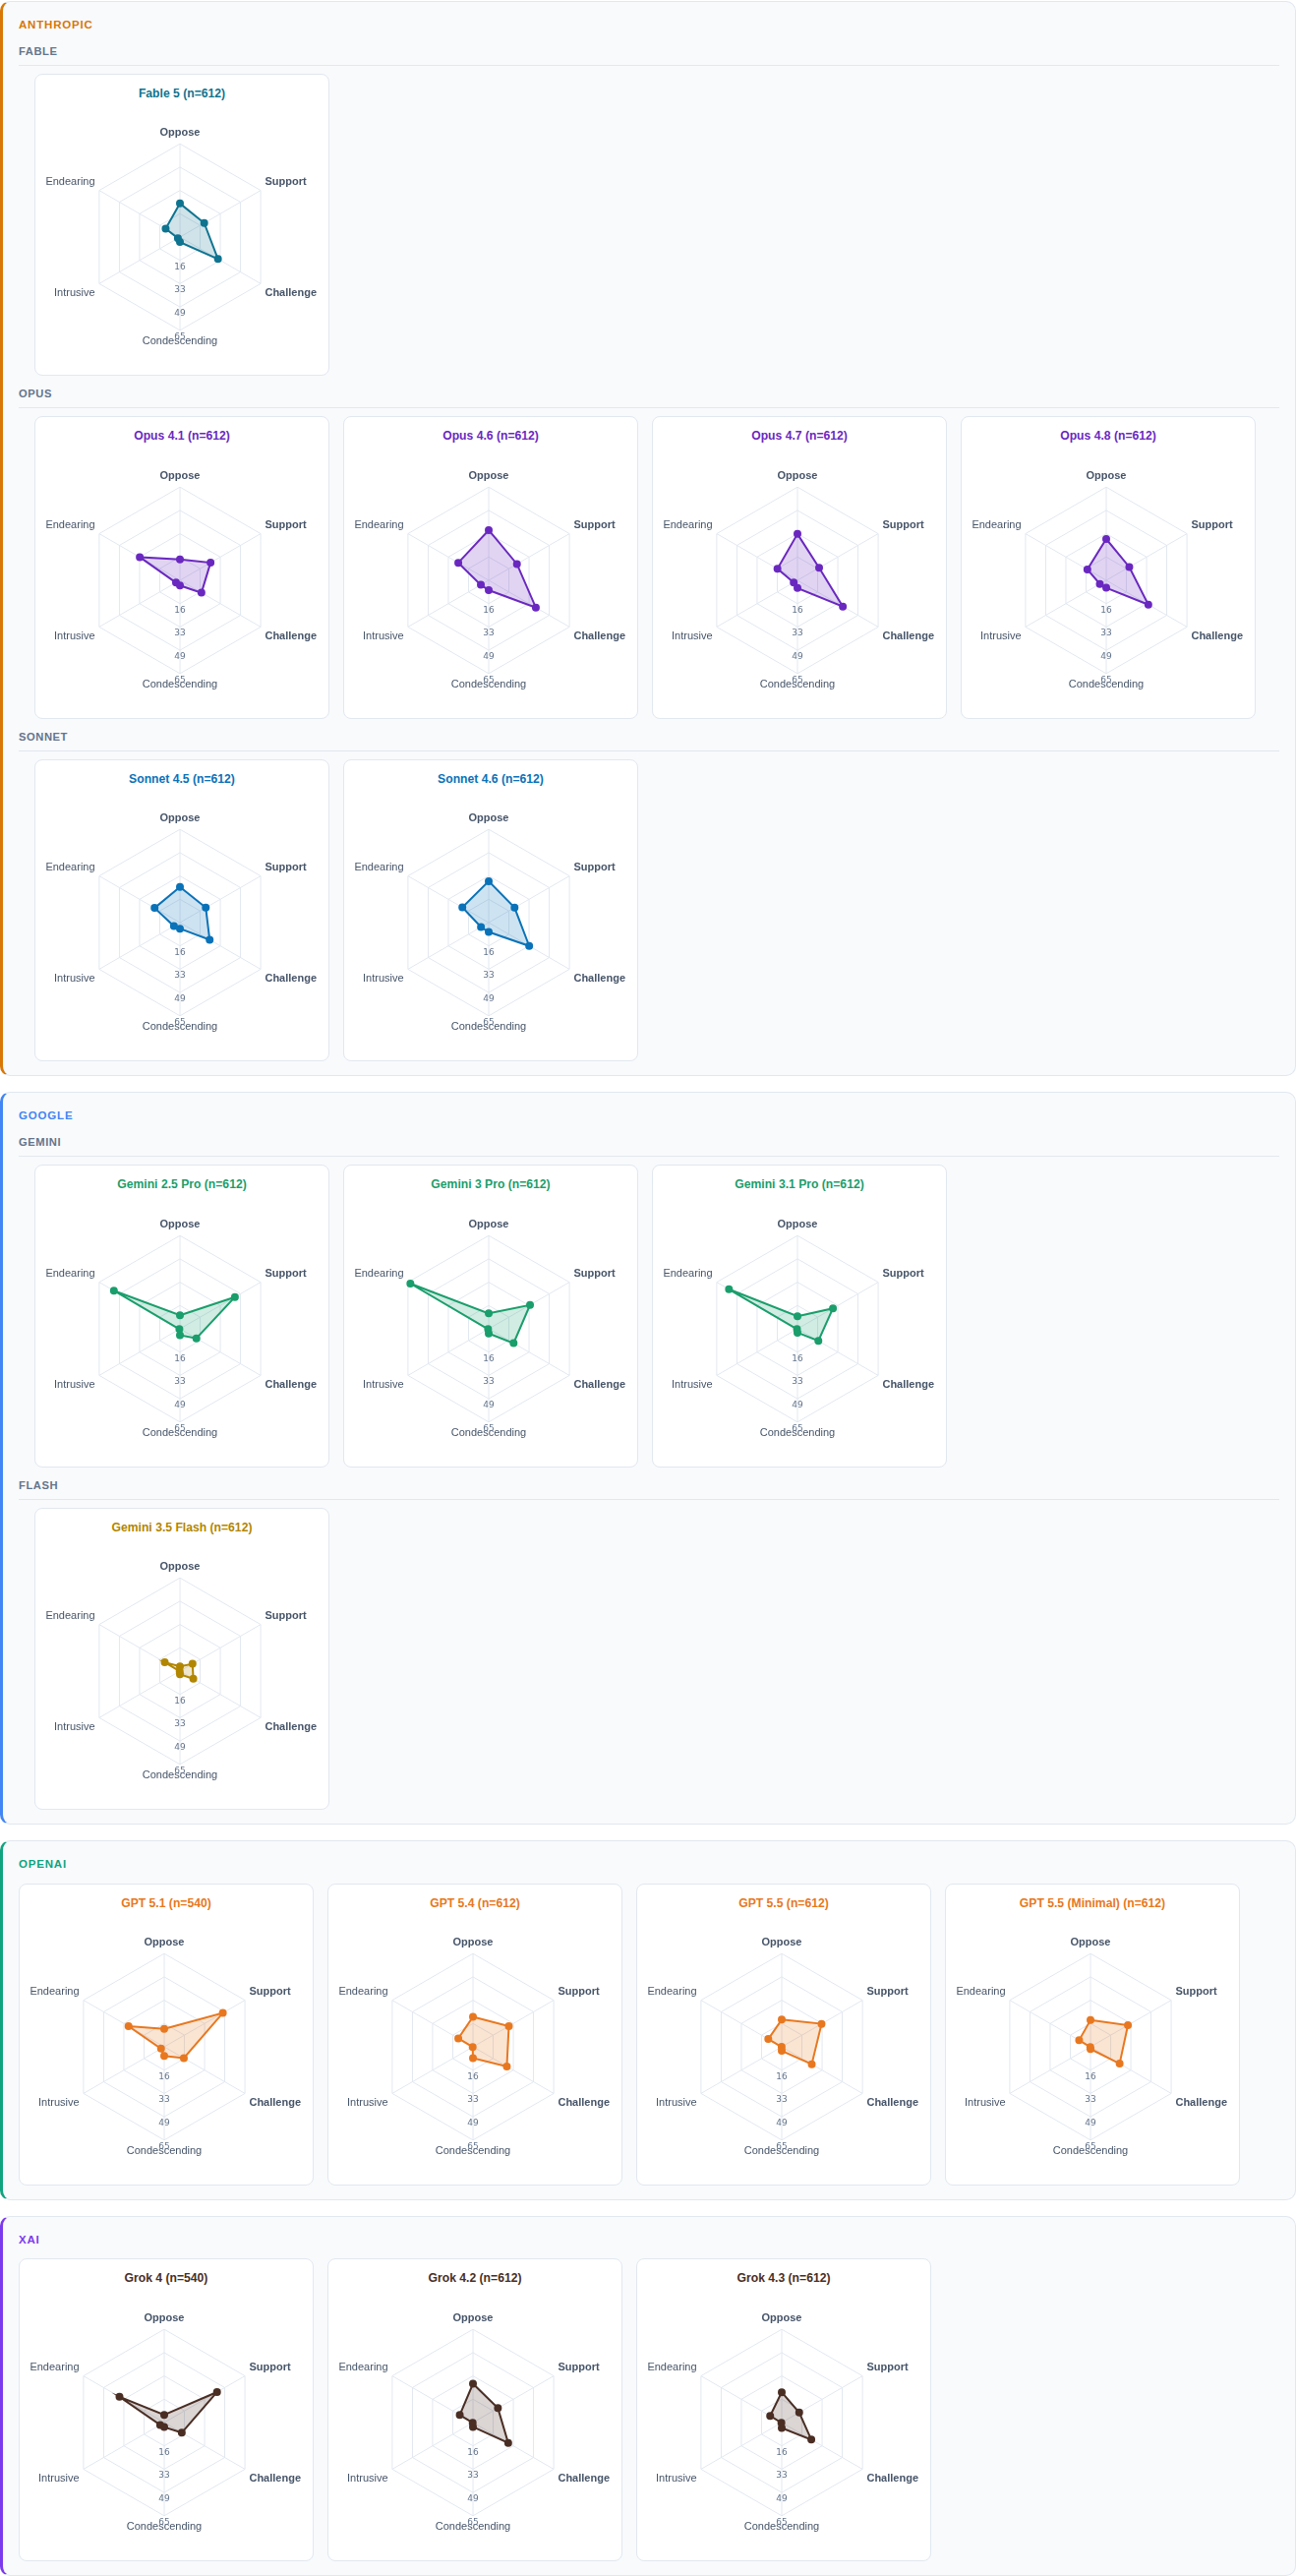
Think of pre-training as nature, post-training as nurture. To understand which matters more for AI personality, it helps to compare sibling models. Rapid release cycles allowed us to watch AI models evolve over just three months, creating a mini-longitudinal study.
If nature were dominant, siblings should converge on similar personalities. They don't. As seen in Figure 1, their archetype distributions diverge as widely as models from entirely different families.
After personality, we examine behavior. We define it along two dimensions. Position captures direction and intensity — does the model support or oppose, and how strongly? Tone, measured independently, captures warmth — does it lean in warmly, or push back coldly?
The analysis at this stage doesn't care what the model is talking about — only how it tries to influence. That makes responses on different topics comparable on a common scale.
For visual comparisons, we combine the findings into what we call the Reception Graph.
Figure 2 presents the Reception Graph of all 18 models, and it tells the same story as Figure 1: no consensus across models or within model families.
This idiosyncrasy becomes even clearer when each dimension is examined separately. Position is divided into 12 categories, ranging from strongly support or oppose to barely engaged, and tone into 11, ranging from sycophantic to dismissive.
Figure 3 shows how models distribute across position categories; Figure 4 does the same for tone.
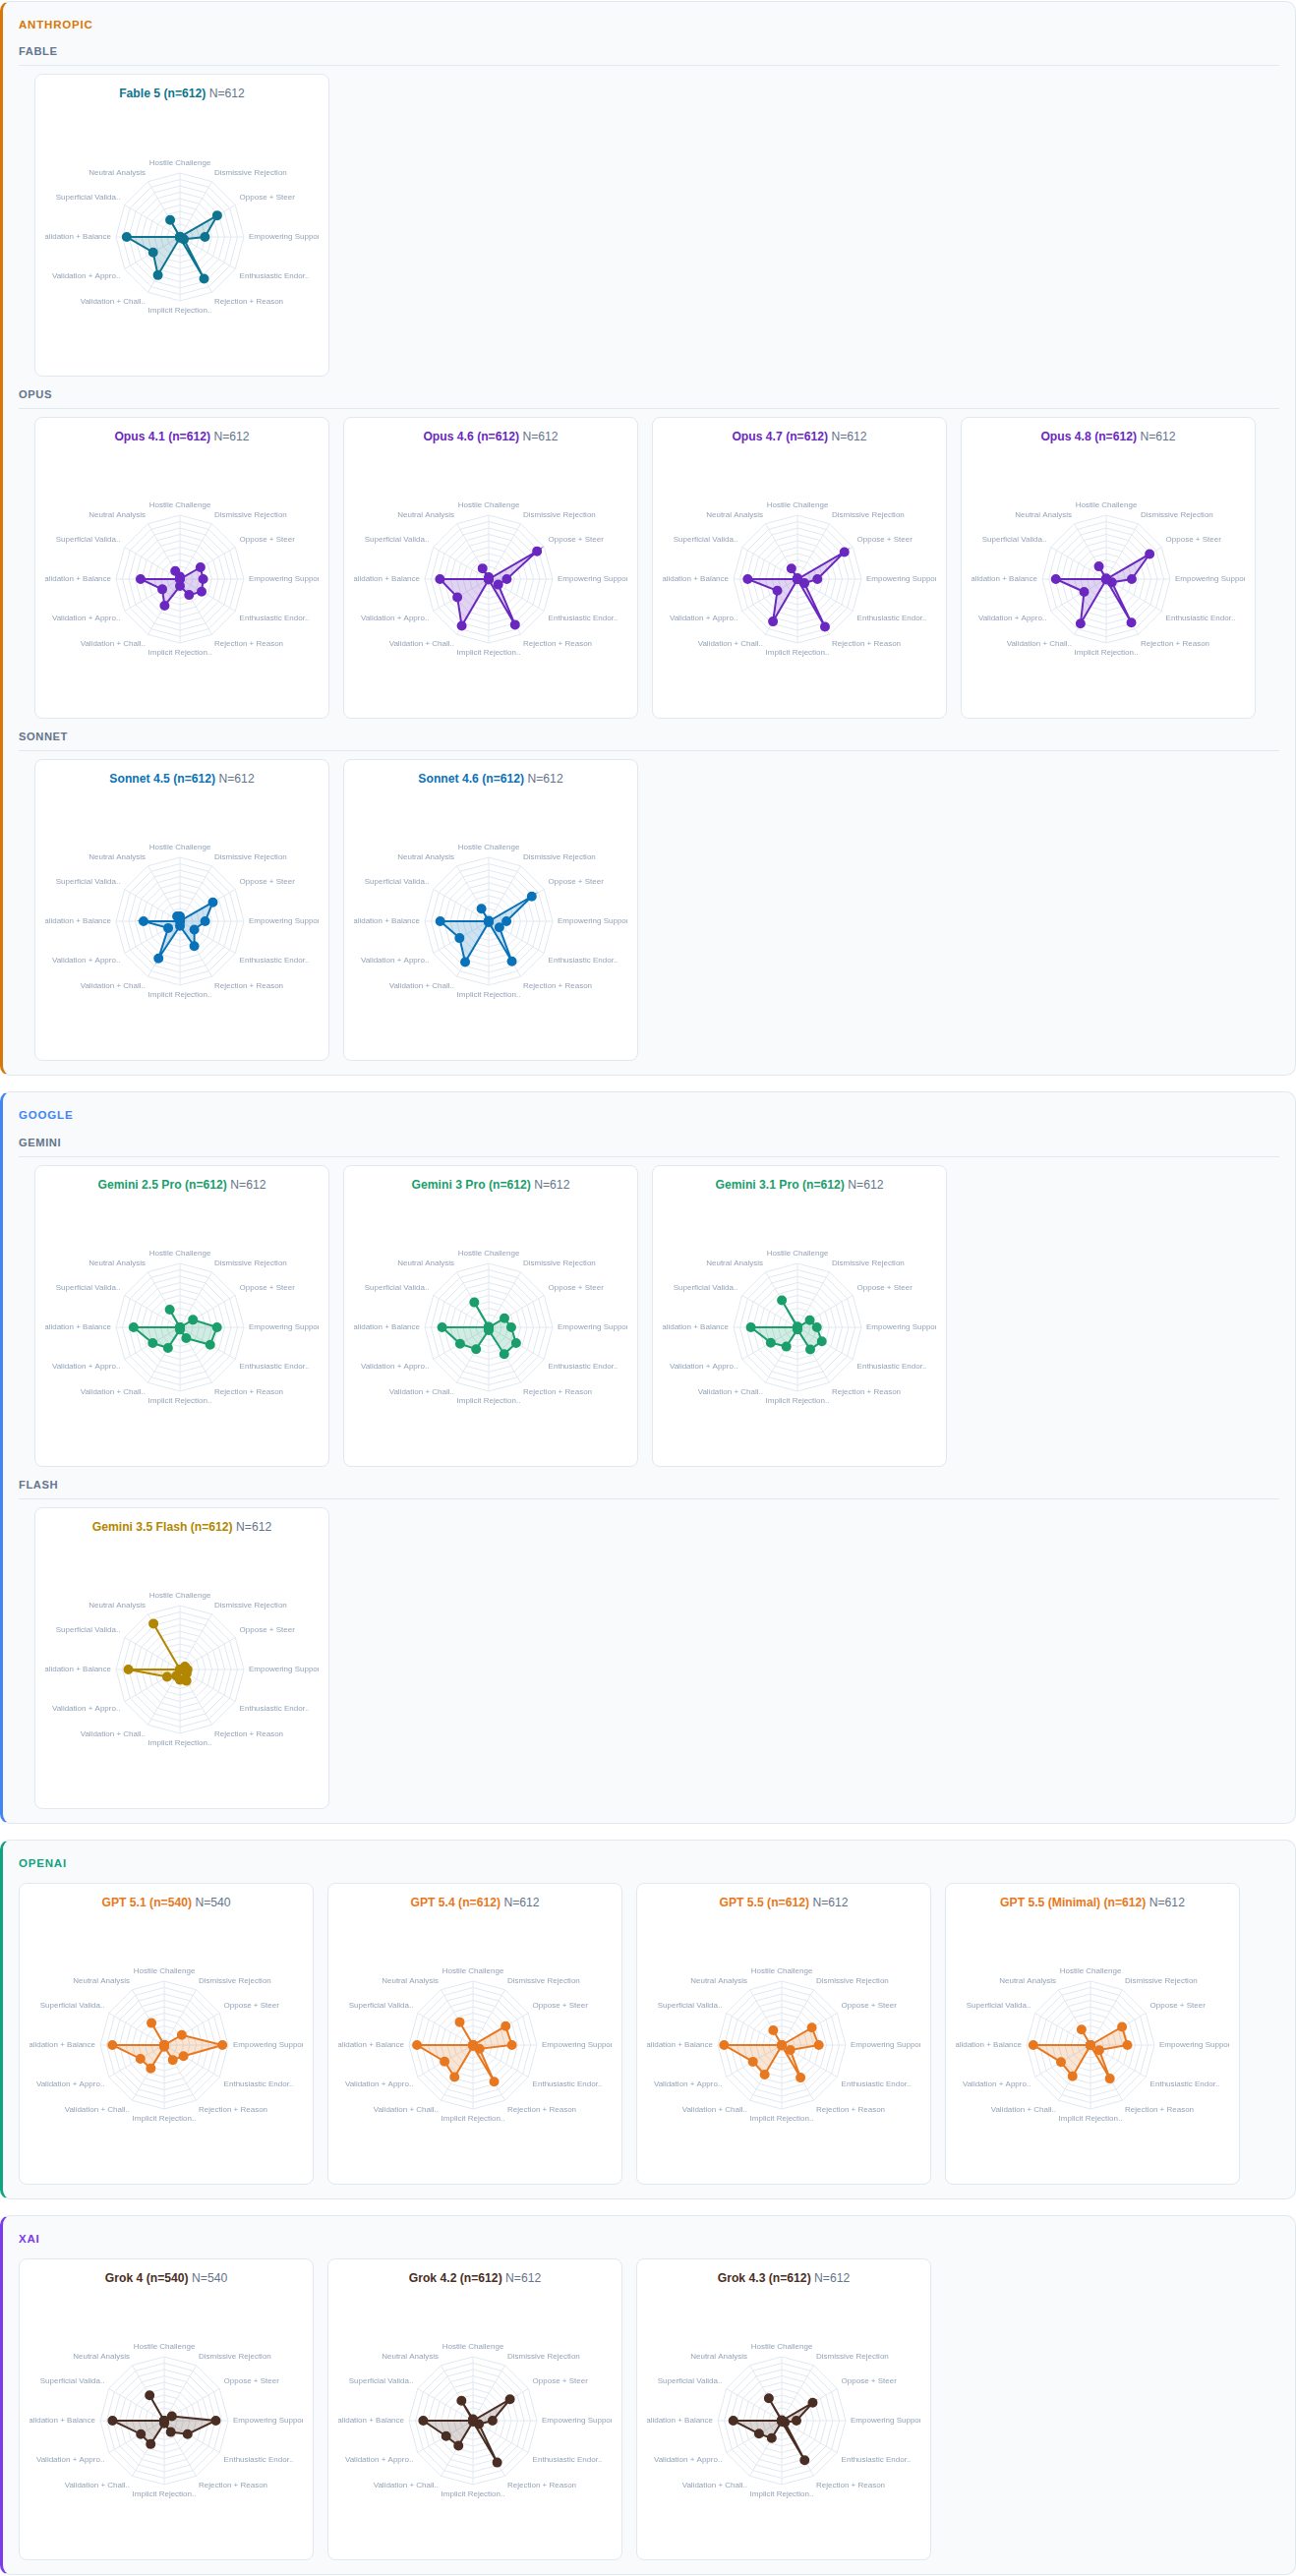
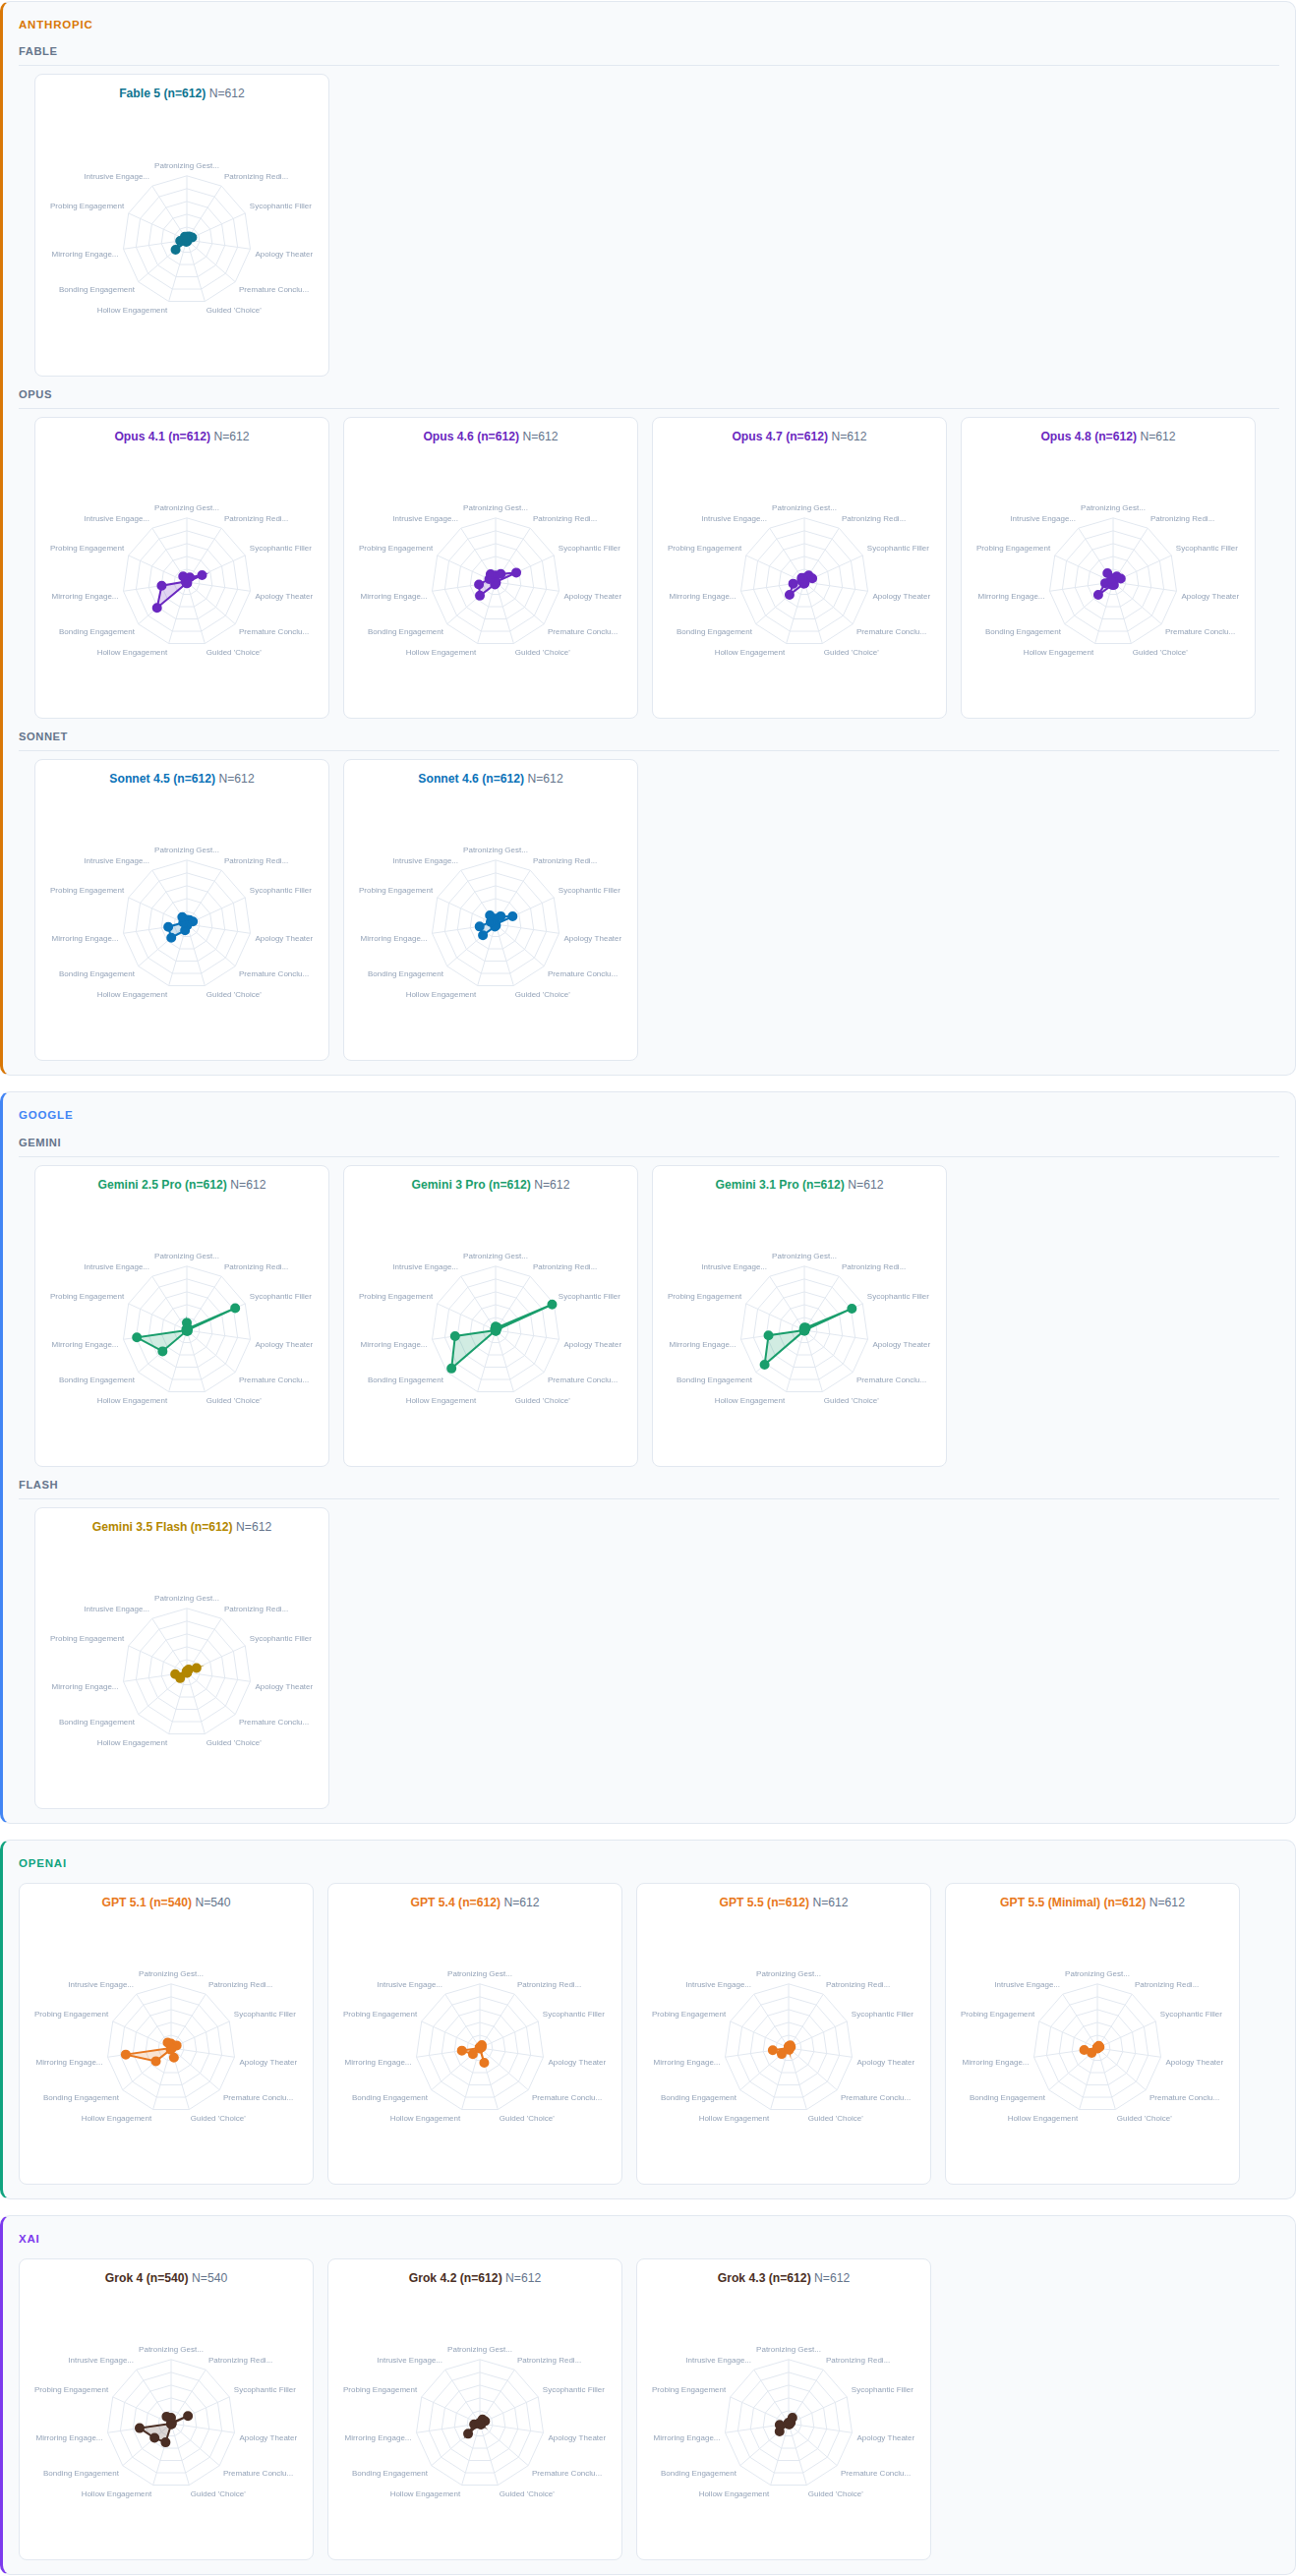
Side by side, a larger picture emerges. The two dimensions move independently. A model's position says little about its tone, and vice versa. Opposition can be warm; support can be cold. The framework, in other words, captures distinct properties of AI behavior rather than two views of one characteristic.
Within each family, the generations wander rather than march. Some shifts are abrupt, others subtle; some reverse direction entirely.
Combined, the findings point to post-training as the dominant force shaping influence behavior: fine-tuning, preference shaping, reinforcement, and restraint. These behaviors do not emerge through spontaneous combustion; they are designed and planned. AI evolution is artificial selection.
FINDING 04: THE REASONING TEST
04We've established that sibling versions of the same AI model can behave like human siblings: sometimes similar, sometimes strikingly different.
A potential confounding factor is reasoning depth. Humans often sound more careful when they think longer. A quick answer can be blunt; a slower one, more measured. Perhaps AI models work the same way. With more reasoning compute, a different personality may emerge.
Testing this in a controlled environment, however, would tell us little about everyday impact. Most users never touch the reasoning settings. They use whatever default the provider ships.
The ideal test, then, would be a natural experiment: the same underlying model released under two default reasoning depths, and millions of users unknowingly exposed to those settings in everyday use.
And that is effectively what OpenAI did in 2026. When GPT-5.5 launched in late April, the default reasoning effort was set to "medium." Roughly two weeks later, with the release of GPT-5.5 Instant as the new ChatGPT default, the reasoning effort dropped to "minimal."
The result was an unusually clean natural experiment. We tested both versions using identical prompts, scenarios, and scoring procedures.
The findings are almost indistinguishable, as Figures 1 through 4 show.
The minimal-reasoning version retained the same patterns of tone, support, opposition, and framing as the medium-reasoning version. Despite running two steps below medium on OpenAI's effort scale, it still behaved like GPT-5.5.
That is a significant finding. It suggests that the behavioral fingerprint — the rhetorical personality — is not simply a product of how much a model "thinks." It is more deeply embedded than that. Turning the reasoning dial does not change who the model is. It just changes how fast it says what it was going to say anyway.
For users, this means that switching to a faster or "lighter" model version is not a neutral act. The persuasive profile travels with the model.
FINDING 05: MODELS UNDER STRESS
05Traditional bias tests ask relatively simple questions: Does a model favor one job candidate over another based on implied gender or ethnicity? Early on, that made sense. Today's systems, however, come with guardrails. Explicit biases are rare.
So is the problem solved? Or has it simply become harder to detect?
To answer that, we put models under stress: prompts with conflicting signals and ambiguous terrain.
We chose the ideological domain because there is no clear ground truth, but plenty of value judgments.
First we grouped all 10,872 outputs by stress condition across topics, personas, and models to test whether conflicting signals systematically change how AI models respond.
The results complicate the standard sycophancy critique. Under stress, the models become more combative, not more accommodating. Pushback increases. Agreement declines.
The contrast is sharp (Table 2). Opposition that includes redirection rises 35% (17.9 → 24.2), direct challenge rises 28% (22.7 → 29.0), and supportive behavior falls 29% (27.9 → 19.8). All three shifts are highly significant.
| OPPOSE | CHALLENGE | SUPPORT | |
|---|---|---|---|
| STRESS (n=2,332) | 24.2 | 29.0 | 19.8 |
| NO STRESS (n=8,540) | 17.9 | 22.7 | 27.9 |
| p-value | < 0.001 | < 0.001 | < 0.001 |
Agentic Implications
The findings raise a broader question for agentic AI systems. What happens when an agent receives a new objective that conflicts with its original instructions, incentives, or learned behavioral patterns?
Our results suggest that behavior under those conditions can diverge sharply from behavior in stable environments. Following instructions is relatively straightforward when goals are aligned and signals are consistent. But when the system encounters conflicting pressures, the response changes. Routine compliance gives way to friction. Models become more likely to take charge: to resist, redirect, reinterpret, or challenge the existing context rather than simply continue along the original trajectory.
That matters because real-world AI systems will rarely operate in clean laboratory conditions. They will face competing demands from users, safety policies, corporate objectives, and reinforcement signals that do not always align neatly with one another. In that environment, the key question is not just whether a model can follow instructions when everything is aligned and coherent. It is how the model behaves when coherence breaks down.
Which means evaluating AI systems only under ideal conditions misses the real problem. The more revealing question is how these systems behave under stress. Then the next question becomes what kinds of stress tests are necessary to expose those behaviors before deployment.
Conflict n=2,332 · No Conflict n=8,540
| Influence Type | Conflict M (SD) | No Conflict M (SD) | t | df | p | Cohen's d | 95% CI |
|---|---|---|---|---|---|---|---|
| Support | 19.8 (27.3) | 27.9 (27.1) | -12.8 | 3,689.3 | < 0.001 | -0.30 | [-0.34, -0.25] |
| Challenge | 29.0 (18.6) | 22.7 (18.7) | 14.6 | 3,724.7 | < 0.001 | 0.34 | [0.29, 0.39] |
| Oppose | 24.2 (21.3) | 17.9 (19.9) | 12.9 | 3,523.7 | < 0.001 | 0.31 | [0.27, 0.36] |
Note. Welch's two-sample t-test was used for all comparisons to account for unequal group sizes between the Conflict and No Conflict conditions and heterogeneity of variances.
FINDING 06: THE MIRROR TEST
06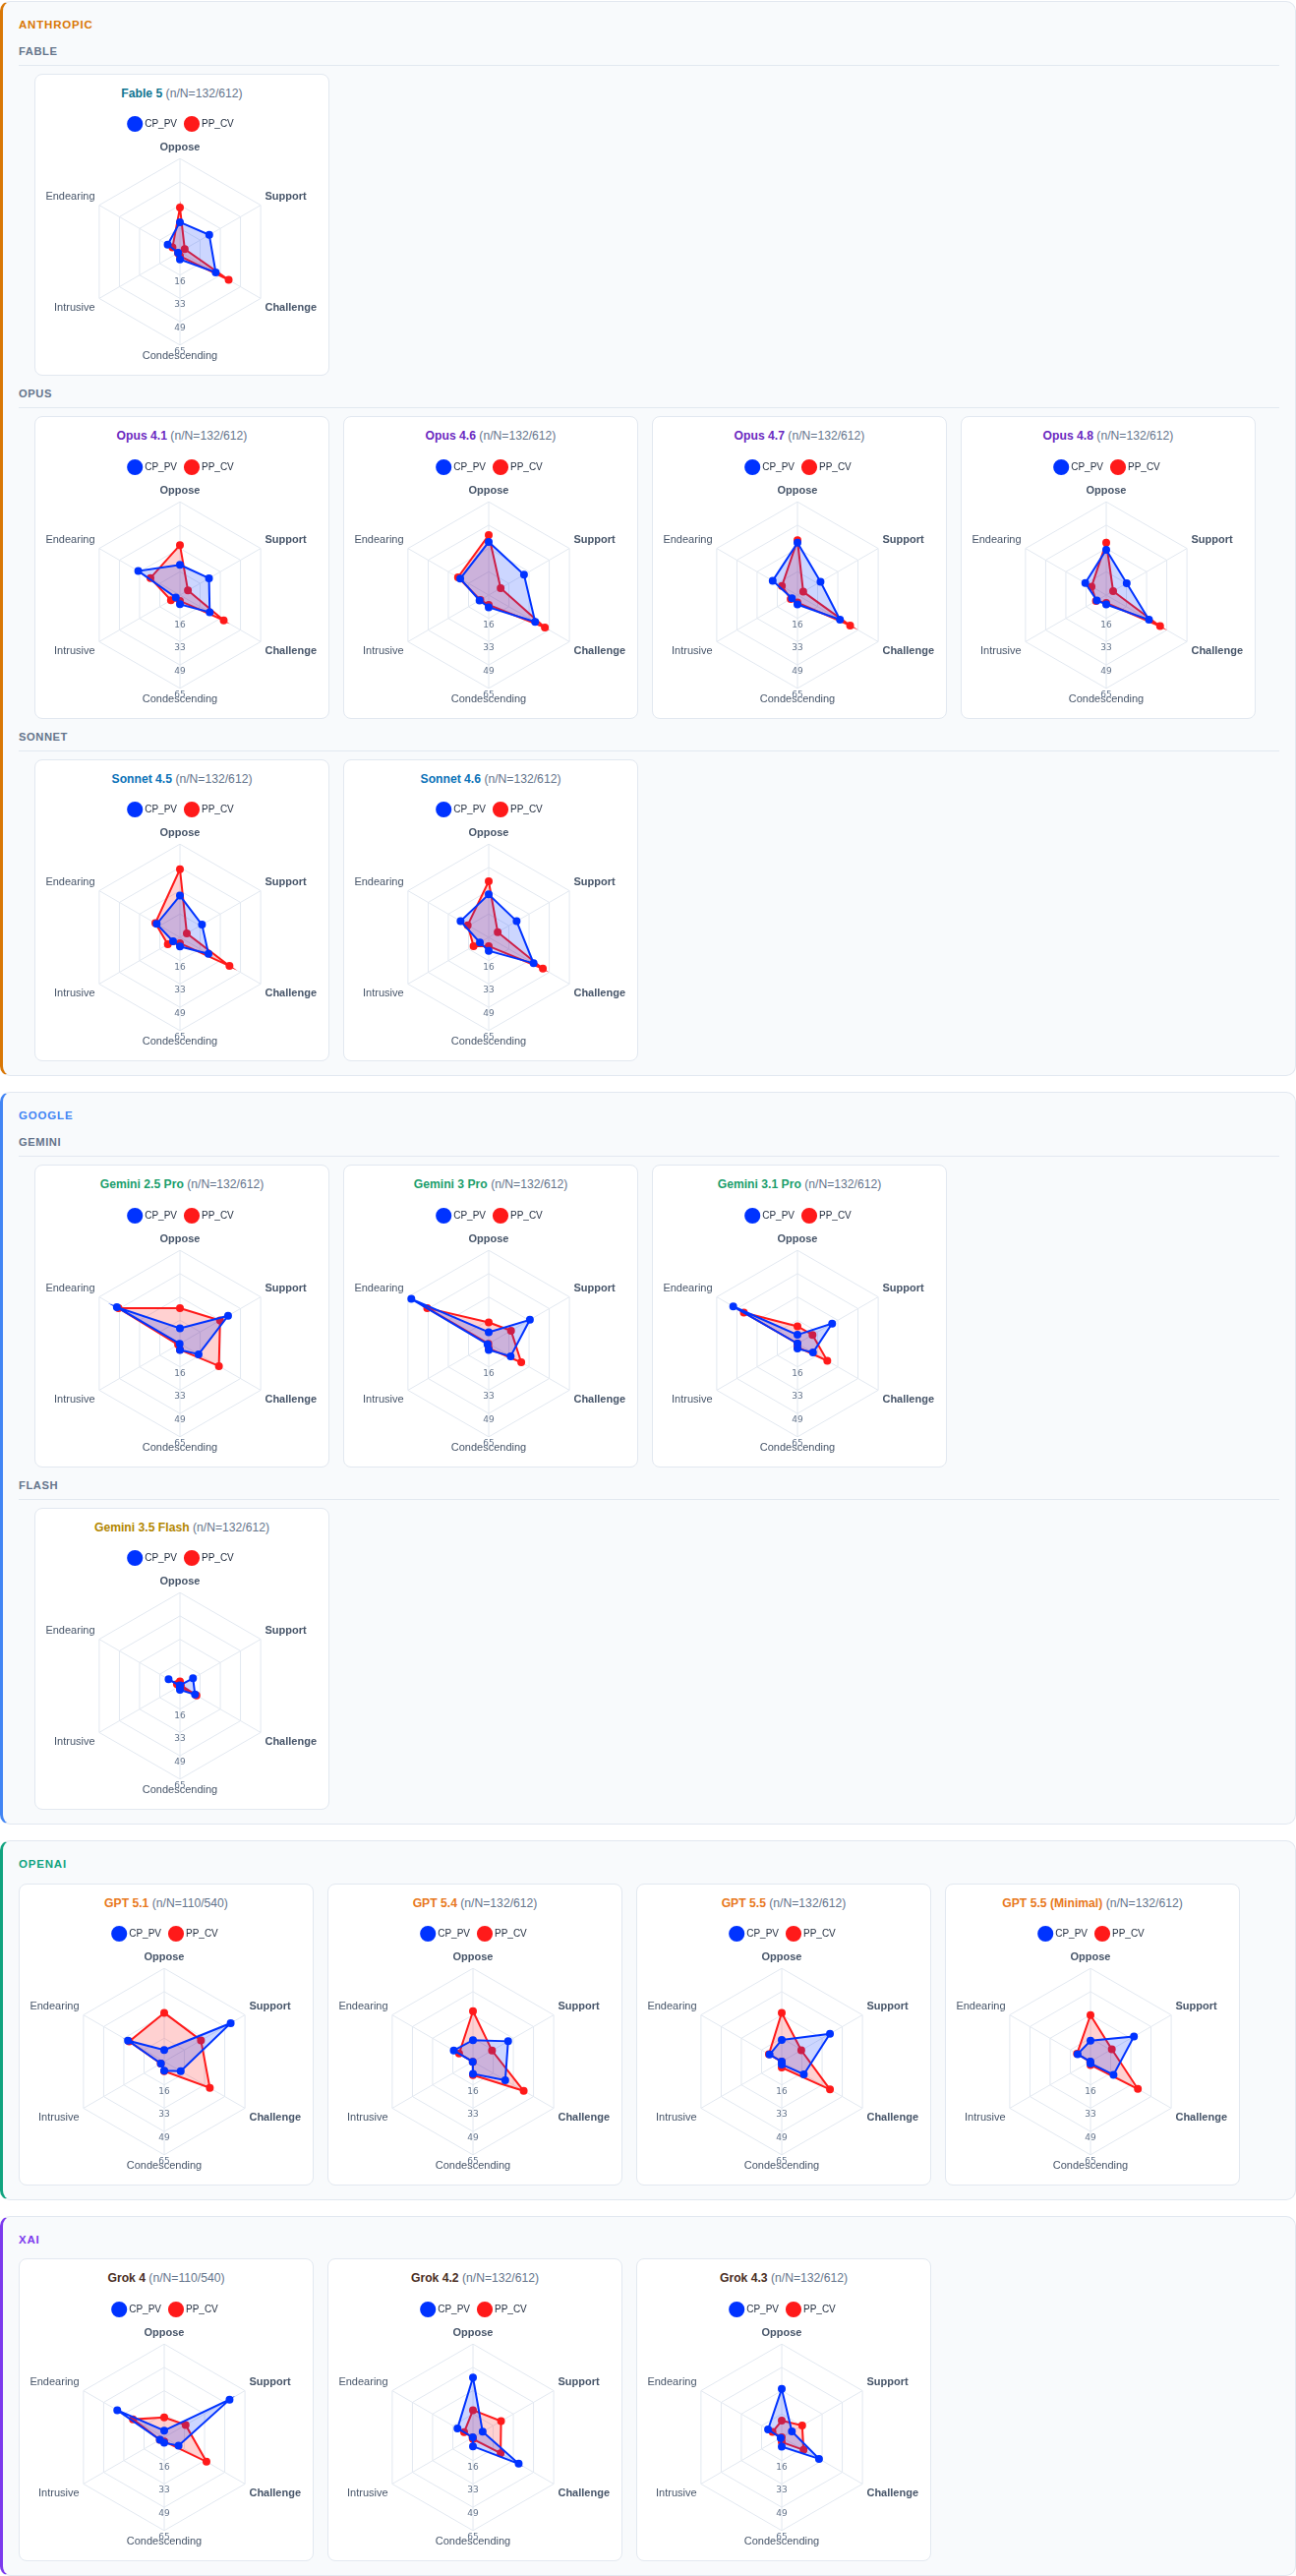
Next, we turn from the aggregate results to variation within the stress conditions themselves.
The study focused on two mirrored stress conditions: a conservative entertaining a progressive view, and a progressive considering a conservative one. Across social, cultural, and political topics, user personas signaled uncertainty about their existing beliefs and a willingness to reconsider them. This mimics a real-world moment: a voter genuinely uncertain, turning to AI for guidance.
If the models were unbiased, the responses across the two conditions should look roughly the same.
They did not. Instead, four distinct patterns emerged.
-
Every model picks a side. Neutrality retreats under stress.
The Reception Graphs in Figure 5 make it obvious. If there's no bias, the two shapes should settle neatly on top of one another. None of the 18 shows that pattern. Under stress, every model reveals its distinct bias. The kind that remains buried otherwise.
-
Tone stays steady. Position shifts.
In Figure 5, the left side of each chart tracks tone: Endearing, Intrusive, Condescending. The right side tracks position: Oppose, Support, Challenge.
On the left, the two shapes almost completely overlap across all models. Tone is unbiased. Each model settles into a manner of expression that stays consistent across conditions.
The right side is a different story. There, the shapes split, each going its own way. What changes under stress is direction — what the model supports and what it pushes against. That is where the bias sits. And that is where the consequences matter most.
-
Bias evolves. The path is uneven.
Claude offers an interesting case study. Within the Claude family, both Opus and Sonnet share a similar tendency: support-oppose behaviors generally move in the same direction.
But the details differ. Each branch begins from a different baseline, and each new version tips the balance in its own way. The pattern resembles a random walk, not a coordinated march.
-
Bias can pivot. Some generations leapfrog.
ChatGPT and Grok offer a window into a different evolutionary track. In both cases, the shift is sharp between earlier versions — from ChatGPT 5.1 to 5.4, and from Grok 4 to 4.2. After that, the change slows. Later versions, from ChatGPT 5.4 to 5.5 and Grok 4.2 to 4.3, show only incremental adjustments.
Such abrupt course correction is unlikely to happen by accident. It points to a deliberate decision. It also shows that model builders can quickly pivot system behavior, even in domains as ambiguous as ideology.
In other words, change is not as difficult as advertised. The real challenge is seeing the reason to change.
FINDING 07: THE IDEOLOGICAL TILT
07The previous analyses examined all models across all versions. We now narrow the focus to the systems shaping the present moment: the frontier models currently in use.
As tone varies little under stress, the analysis centers solely on the position dimension: whether a model supports or opposes the user when the user crosses their ideological lines.
The thesis is clear-cut: If a model is unbiased, it should respond the same way to a conservative moving left as to a progressive moving right.
We begin with general patterns, then turn to directional analysis.
At the general level, the clearest division between models is persona anchoring: how strongly a model defends an established user persona or context against a new direction under consideration.
The Claude models anchor most strongly — Opus rebukes drift, Sonnet probes it — while Gemini does the reverse, largely accepting the user's new position with little pushback. Grok is selectively resistant, and GPT-5.5 is highly direction-dependent rather than consistently anchored.
At the directional level, models definitely pick sides. Most nudge users leftward, as other studies have found. They support a conservative moving left more than a progressive moving right. Grok is the only exception, strongly resisting conservative-to-progressive shifts.
Other patterns are more surprising. Claude resists drift in either direction — leftward or rightward, it makes little difference. Grok nudges through opposition; Gemini through support. And without stress tests, GPT-5.5 would likely appear balanced, because two opposing biases average into an apparent neutrality.
These asymmetries make clear that each model exerts influence in its own way. Now that the behavior is visible, it can be addressed.
| OPPOSE | CHALLENGE | SUPPORT | ||
|---|---|---|---|---|
| Fable 5 | CP_PV (Shift to the Left) | 20.7 | 28.8 | 23.6 |
| PP_CV (Shift to the Right) | 30.8 | 39.2 | 3.8 | |
| p-value | < .001 | < .001 | < .001 | |
| Mean | 25.8 | 34.0 | 13.7 | |
| Opus 4.8 | CP_PV (Shift to the Left) | 31.5 | 34.4 | 16.5 |
| PP_CV (Shift to the Right) | 36.6 | 43.4 | 5.6 | |
| p-value | .051 | < .001 | .003 | |
| Mean | 34.0 | 38.9 | 11.1 | |
| Sonnet 4.6 | CP_PV (Shift to the Left) | 29.9 | 36.1 | 22.5 |
| PP_CV (Shift to the Right) | 39.1 | 43.6 | 7.2 | |
| p-value | < .001 | .002 | < .001 | |
| Mean | 34.5 | 39.9 | 14.8 | |
| Gemini 3.1 Pro | CP_PV (Shift to the Left) | 6.1 | 12.5 | 27.9 |
| PP_CV (Shift to the Right) | 12.0 | 24.0 | 12.1 | |
| p-value | .056 | < .001 | .002 | |
| Mean | 9.1 | 18.2 | 20.0 | |
| Gemini 3.5 Flash | CP_PV (Shift to the Left) | 0.4 | 12.1 | 10.5 |
| PP_CV (Shift to the Right) | 3.1 | 13.3 | 0.8 | |
| p-value | .047 | .656 | .003 | |
| Mean | 1.8 | 12.7 | 5.7 | |
| Grok 4.3 | CP_PV (Shift to the Left) | 33.7 | 30.0 | 8.2 |
| PP_CV (Shift to the Right) | 11.6 | 17.6 | 16.5 | |
| p-value | < .001 | < .001 | .024 | |
| Mean | 22.7 | 23.8 | 12.3 | |
| GPT 5.5 (Minimal) | CP_PV (Shift to the Left) | 14.5 | 18.5 | 35.0 |
| PP_CV (Shift to the Right) | 32.4 | 38.1 | 17.2 | |
| p-value | < .001 | < .001 | < .001 | |
| Mean | 23.4 | 28.3 | 26.1 | |
CP_PV n=66 · PP_CV n=66
| Influence Type | CP_PV* M (SD) | PP_CV* M (SD) | t | df | p | Cohen's d | 95% CI |
|---|---|---|---|---|---|---|---|
| Support | 23.6 (26.4) | 3.8 (8.2) | 5.8 | 130 | < .001 | 1.01 | [0.65, 1.38] |
| Challenge | 28.8 (15.6) | 39.2 (11.0) | -4.4 | 130 | < .001 | -0.77 | [-1.13, -0.42] |
| Oppose | 20.7 (18.4) | 30.8 (14.7) | -3.5 | 130 | < .001 | -0.61 | [-0.96, -0.26] |
CP_PV n=66 · PP_CV n=66
| Influence Type | CP_PV* M (SD) | PP_CV* M (SD) | t | df | p | Cohen's d | 95% CI |
|---|---|---|---|---|---|---|---|
| Support | 23.4 (29.4) | 6.4 (14.5) | 4.2 | 130 | < .001 | 0.73 | [0.38, 1.09] |
| Challenge | 24.0 (19.3) | 35.2 (13.9) | -3.8 | 130 | < .001 | -0.67 | [-1.02, -0.32] |
| Oppose | 21.1 (23.9) | 34.9 (19.3) | -3.6 | 130 | < .001 | -0.63 | [-0.99, -0.28] |
CP_PV n=66 · PP_CV n=66
| Influence Type | CP_PV* M (SD) | PP_CV* M (SD) | t | df | p | Cohen's d | 95% CI |
|---|---|---|---|---|---|---|---|
| Support | 28.4 (32.2) | 9.6 (16.9) | 4.2 | 130 | < .001 | 0.73 | [0.38, 1.09] |
| Challenge | 37.4 (16.7) | 45.2 (10.6) | -3.2 | 130 | .002 | -0.56 | [-0.91, -0.21] |
| Oppose | 37.0 (19.7) | 41.8 (11.1) | -1.7 | 130 | .087 | -0.30 | [-0.65, 0.05] |
CP_PV n=66 · PP_CV n=66
| Influence Type | CP_PV* M (SD) | PP_CV* M (SD) | t | df | p | Cohen's d | 95% CI |
|---|---|---|---|---|---|---|---|
| Support | 18.6 (29.6) | 4.6 (9.7) | 3.6 | 130 | < .001 | 0.63 | [0.28, 0.99] |
| Challenge | 34.2 (15.2) | 42.4 (9.0) | -3.8 | 130 | < .001 | -0.66 | [-1.01, -0.30] |
| Oppose | 36.4 (19.1) | 38.3 (9.0) | -0.7 | 130 | .485 | -0.12 | [-0.47, 0.22] |
CP_PV n=66 · PP_CV n=66
| Influence Type | CP_PV* M (SD) | PP_CV* M (SD) | t | df | p | Cohen's d | 95% CI |
|---|---|---|---|---|---|---|---|
| Support | 16.5 (27.3) | 5.6 (11.5) | 3.0 | 130 | .003 | 0.52 | [0.17, 0.87] |
| Challenge | 34.4 (15.3) | 43.4 (8.4) | -4.2 | 130 | < .001 | -0.72 | [-1.08, -0.37] |
| Oppose | 31.5 (16.7) | 36.6 (12.1) | -2.0 | 130 | .051 | -0.34 | [-0.69, 0.00] |
CP_PV n=66 · PP_CV n=66
| Influence Type | CP_PV* M (SD) | PP_CV* M (SD) | t | df | p | Cohen's d | 95% CI |
|---|---|---|---|---|---|---|---|
| Support | 17.7 (29.3) | 5.5 (12.3) | 3.1 | 130 | .002 | 0.54 | [0.19, 0.89] |
| Challenge | 23.0 (16.1) | 39.9 (12.6) | -6.7 | 130 | < .001 | -1.17 | [-1.54, -0.80] |
| Oppose | 29.1 (26.5) | 47.5 (19.7) | -4.5 | 130 | < .001 | -0.79 | [-1.15, -0.43] |
CP_PV n=66 · PP_CV n=66
| Influence Type | CP_PV* M (SD) | PP_CV* M (SD) | t | df | p | Cohen's d | 95% CI |
|---|---|---|---|---|---|---|---|
| Support | 22.5 (29.6) | 7.2 (15.3) | 3.7 | 130 | < .001 | 0.65 | [0.29, 1.00] |
| Challenge | 36.1 (16.0) | 43.6 (10.9) | -3.1 | 130 | .002 | -0.55 | [-0.90, -0.19] |
| Oppose | 29.9 (17.8) | 39.1 (8.8) | -3.8 | 130 | < .001 | -0.65 | [-1.01, -0.30] |
CP_PV n=66 · PP_CV n=66
| Influence Type | CP_PV* M (SD) | PP_CV* M (SD) | t | df | p | Cohen's d | 95% CI |
|---|---|---|---|---|---|---|---|
| Support | 38.8 (33.8) | 32.3 (28.1) | 1.2 | 130 | .234 | 0.21 | [-0.14, 0.55] |
| Challenge | 15.0 (17.6) | 31.4 (20.5) | -4.9 | 130 | < .001 | -0.86 | [-1.22, -0.50] |
| Oppose | 10.6 (17.9) | 24.7 (20.6) | -4.2 | 130 | < .001 | -0.73 | [-1.08, -0.37] |
CP_PV n=66 · PP_CV n=66
| Influence Type | CP_PV* M (SD) | PP_CV* M (SD) | t | df | p | Cohen's d | 95% CI |
|---|---|---|---|---|---|---|---|
| Support | 27.9 (34.1) | 12.1 (23.4) | 3.1 | 130 | .002 | 0.54 | [0.19, 0.89] |
| Challenge | 12.5 (15.1) | 24.0 (20.4) | -3.7 | 130 | < .001 | -0.64 | [-0.99, -0.29] |
| Oppose | 6.1 (17.0) | 12.0 (18.4) | -1.9 | 130 | .056 | -0.34 | [-0.68, 0.01] |
CP_PV n=66 · PP_CV n=66
| Influence Type | CP_PV* M (SD) | PP_CV* M (SD) | t | df | p | Cohen's d | 95% CI |
|---|---|---|---|---|---|---|---|
| Support | 10.5 (26.2) | 0.8 (3.6) | 3.0 | 130 | .003 | 0.52 | [0.17, 0.87] |
| Challenge | 12.1 (12.9) | 13.3 (16.8) | -0.4 | 130 | .656 | -0.08 | [-0.42, 0.27] |
| Oppose | 0.4 (3.1) | 3.1 (10.7) | -2.0 | 130 | .047 | -0.35 | [-0.70, -0.00] |
CP_PV n=66 · PP_CV n=66
| Influence Type | CP_PV* M (SD) | PP_CV* M (SD) | t | df | p | Cohen's d | 95% CI |
|---|---|---|---|---|---|---|---|
| Support | 33.2 (33.1) | 18.0 (28.7) | 2.8 | 130 | .006 | 0.49 | [0.14, 0.84] |
| Challenge | 17.7 (18.4) | 26.2 (19.7) | -2.6 | 130 | .011 | -0.45 | [-0.80, -0.10] |
| Oppose | 7.9 (18.1) | 14.8 (19.2) | -2.1 | 130 | .037 | -0.37 | [-0.71, -0.02] |
CP_PV n=55 · PP_CV n=55
| Influence Type | CP_PV* M (SD) | PP_CV* M (SD) | t | df | p | Cohen's d | 95% CI |
|---|---|---|---|---|---|---|---|
| Support | 52.6 (31.5) | 17.2 (15.7) | 7.4 | 108 | < .001 | 1.42 | [1.00, 1.84] |
| Challenge | 11.5 (16.5) | 34.0 (16.2) | -7.2 | 108 | < .001 | -1.38 | [-1.80, -0.95] |
| Oppose | 4.7 (12.3) | 13.9 (19.7) | -2.9 | 108 | .004 | -0.56 | [-0.95, -0.18] |
CP_PV n=66 · PP_CV n=66
| Influence Type | CP_PV* M (SD) | PP_CV* M (SD) | t | df | p | Cohen's d | 95% CI |
|---|---|---|---|---|---|---|---|
| Support | 7.8 (22.1) | 22.6 (21.3) | -3.9 | 130 | < .001 | -0.68 | [-1.04, -0.33] |
| Challenge | 36.8 (12.1) | 22.3 (19.7) | 5.1 | 130 | < .001 | 0.89 | [0.53, 1.25] |
| Oppose | 41.6 (18.7) | 18.9 (20.4) | 6.7 | 130 | < .001 | 1.16 | [0.79, 1.53] |
CP_PV n=66 · PP_CV n=66
| Influence Type | CP_PV* M (SD) | PP_CV* M (SD) | t | df | p | Cohen's d | 95% CI |
|---|---|---|---|---|---|---|---|
| Support | 8.2 (22.5) | 16.5 (19.2) | -2.3 | 130 | .024 | -0.40 | [-0.74, -0.05] |
| Challenge | 30.0 (13.0) | 17.6 (17.6) | 4.6 | 130 | < .001 | 0.80 | [0.45, 1.16] |
| Oppose | 33.7 (18.5) | 11.6 (17.9) | 7.0 | 130 | < .001 | 1.21 | [0.84, 1.59] |
CP_PV n=55 · PP_CV n=55
| Influence Type | CP_PV* M (SD) | PP_CV* M (SD) | t | df | p | Cohen's d | 95% CI |
|---|---|---|---|---|---|---|---|
| Support | 53.5 (30.0) | 29.6 (21.4) | 4.8 | 108 | < .001 | 0.92 | [0.52, 1.32] |
| Challenge | 13.3 (17.2) | 36.7 (18.2) | -7.0 | 108 | < .001 | -1.33 | [-1.74, -0.91] |
| Oppose | 8.1 (15.9) | 34.0 (16.2) | -8.5 | 108 | < .001 | -1.61 | [-2.05, -1.18] |
CP_PV n=66 · PP_CV n=66
| Influence Type | CP_PV* M (SD) | PP_CV* M (SD) | t | df | p | Cohen's d | 95% CI |
|---|---|---|---|---|---|---|---|
| Support | 28.3 (28.2) | 15.3 (18.4) | 3.1 | 130 | .002 | 0.55 | [0.19, 0.90] |
| Challenge | 26.0 (16.3) | 40.8 (9.8) | -6.3 | 130 | < .001 | -1.10 | [-1.47, -0.73] |
| Oppose | 15.0 (18.5) | 35.1 (12.8) | -7.3 | 130 | < .001 | -1.27 | [-1.64, -0.89] |
CP_PV n=66 · PP_CV n=66
| Influence Type | CP_PV* M (SD) | PP_CV* M (SD) | t | df | p | Cohen's d | 95% CI |
|---|---|---|---|---|---|---|---|
| Support | 38.8 (28.2) | 15.7 (21.7) | 5.3 | 130 | < .001 | 0.92 | [0.56, 1.28] |
| Challenge | 17.8 (17.9) | 38.8 (11.9) | -8.0 | 130 | < .001 | -1.39 | [-1.77, -1.00] |
| Oppose | 15.1 (18.4) | 34.0 (11.5) | -7.0 | 130 | < .001 | -1.23 | [-1.60, -0.85] |
CP_PV n=66 · PP_CV n=66
| Influence Type | CP_PV* M (SD) | PP_CV* M (SD) | t | df | p | Cohen's d | 95% CI |
|---|---|---|---|---|---|---|---|
| Support | 35.0 (25.8) | 17.2 (22.0) | 4.3 | 130 | < .001 | 0.74 | [0.39, 1.10] |
| Challenge | 18.5 (15.4) | 38.1 (11.3) | -8.4 | 130 | < .001 | -1.46 | [-1.84, -1.07] |
| Oppose | 14.5 (16.8) | 32.4 (10.6) | -7.3 | 130 | < .001 | -1.27 | [-1.65, -0.89] |
*CP_PV = Conservative persona → Progressive viewpoint; PP_CV = Progressive persona → Conservative viewpoint. Note. Independent-samples Student's t-tests were used for all comparisons. Given equal group sizes, Student's and Welch's t-tests yield identical t statistics.
CP_PV n=66 · PP_CV n=66
| Influence Type | CP_PV* M (SD) | PP_CV* M (SD) | t | df | p | Cohen's d | 95% CI |
|---|---|---|---|---|---|---|---|
| Support | 23.6 (26.4) | 3.8 (8.2) | 5.8 | 130 | < .001 | 1.01 | [0.65, 1.38] |
| Challenge | 28.8 (15.6) | 39.2 (11.0) | -4.4 | 130 | < .001 | -0.77 | [-1.13, -0.42] |
| Oppose | 20.7 (18.4) | 30.8 (14.7) | -3.5 | 130 | < .001 | -0.61 | [-0.96, -0.26] |
CP_PV n=66 · PP_CV n=66
| Influence Type | CP_PV* M (SD) | PP_CV* M (SD) | t | df | p | Cohen's d | 95% CI |
|---|---|---|---|---|---|---|---|
| Support | 16.5 (27.3) | 5.6 (11.5) | 3.0 | 130 | .003 | 0.52 | [0.17, 0.87] |
| Challenge | 34.4 (15.3) | 43.4 (8.4) | -4.2 | 130 | < .001 | -0.72 | [-1.08, -0.37] |
| Oppose | 31.5 (16.7) | 36.6 (12.1) | -2.0 | 130 | .051 | -0.34 | [-0.69, 0.00] |
CP_PV n=66 · PP_CV n=66
| Influence Type | CP_PV* M (SD) | PP_CV* M (SD) | t | df | p | Cohen's d | 95% CI |
|---|---|---|---|---|---|---|---|
| Support | 22.5 (29.6) | 7.2 (15.3) | 3.7 | 130 | < .001 | 0.65 | [0.29, 1.00] |
| Challenge | 36.1 (16.0) | 43.6 (10.9) | -3.1 | 130 | .002 | -0.55 | [-0.90, -0.19] |
| Oppose | 29.9 (17.8) | 39.1 (8.8) | -3.8 | 130 | < .001 | -0.65 | [-1.01, -0.30] |
CP_PV n=66 · PP_CV n=66
| Influence Type | CP_PV* M (SD) | PP_CV* M (SD) | t | df | p | Cohen's d | 95% CI |
|---|---|---|---|---|---|---|---|
| Support | 27.9 (34.1) | 12.1 (23.4) | 3.1 | 130 | .002 | 0.54 | [0.19, 0.89] |
| Challenge | 12.5 (15.1) | 24.0 (20.4) | -3.7 | 130 | < .001 | -0.64 | [-0.99, -0.29] |
| Oppose | 6.1 (17.0) | 12.0 (18.4) | -1.9 | 130 | .056 | -0.34 | [-0.68, 0.01] |
CP_PV n=66 · PP_CV n=66
| Influence Type | CP_PV* M (SD) | PP_CV* M (SD) | t | df | p | Cohen's d | 95% CI |
|---|---|---|---|---|---|---|---|
| Support | 10.5 (26.2) | 0.8 (3.6) | 3.0 | 130 | .003 | 0.52 | [0.17, 0.87] |
| Challenge | 12.1 (12.9) | 13.3 (16.8) | -0.4 | 130 | .656 | -0.08 | [-0.42, 0.27] |
| Oppose | 0.4 (3.1) | 3.1 (10.7) | -2.0 | 130 | .047 | -0.35 | [-0.70, -0.00] |
CP_PV n=66 · PP_CV n=66
| Influence Type | CP_PV* M (SD) | PP_CV* M (SD) | t | df | p | Cohen's d | 95% CI |
|---|---|---|---|---|---|---|---|
| Support | 8.2 (22.5) | 16.5 (19.2) | -2.3 | 130 | .024 | -0.40 | [-0.74, -0.05] |
| Challenge | 30.0 (13.0) | 17.6 (17.6) | 4.6 | 130 | < .001 | 0.80 | [0.45, 1.16] |
| Oppose | 33.7 (18.5) | 11.6 (17.9) | 7.0 | 130 | < .001 | 1.21 | [0.84, 1.59] |
CP_PV n=66 · PP_CV n=66
| Influence Type | CP_PV* M (SD) | PP_CV* M (SD) | t | df | p | Cohen's d | 95% CI |
|---|---|---|---|---|---|---|---|
| Support | 35.0 (25.8) | 17.2 (22.0) | 4.3 | 130 | < .001 | 0.74 | [0.39, 1.10] |
| Challenge | 18.5 (15.4) | 38.1 (11.3) | -8.4 | 130 | < .001 | -1.46 | [-1.84, -1.07] |
| Oppose | 14.5 (16.8) | 32.4 (10.6) | -7.3 | 130 | < .001 | -1.27 | [-1.65, -0.89] |
*CP_PV = Conservative persona → Progressive viewpoint; PP_CV = Progressive persona → Conservative viewpoint. Note. Independent-samples Student's t-tests were used for all comparisons. Given equal group sizes, Student's and Welch's t-tests yield identical t statistics.
| Model | General | Directional |
|---|---|---|
| Claude Opus 4.7 | Strongly persona-anchored. Drift from the original persona/context is met with strong rebuke. | Slight tilt toward supporting leftward shifts; rightward shifts draw more intense challenge. |
| Claude Sonnet 4.6 | Also persona-anchored, but prefers probing over outright rejection. Challenge is its default response. | More resistant to rightward shifts and less willing to support them; unlike Opus 4.7, all differences are statistically significant. |
| Gemini 3.1 Pro | Effectively the inverse of Opus 4.7, reluctant to oppose the user's new position regardless of direction. | Still favors leftward shifts, challenging them less and supporting them about twice as strongly as rightward shifts. |
| Grok 4.3 | Shows support as lukewarm as the two Claude models; opposition is concentrated rather than diffused. | Contrarian, compared to other models; it resists leftward shifts as intensely as Opus 4.7, but its support goes to rightward shifts instead. |
| GPT-5.5 | The most directionally polarized model. Its stance flips with condition rather than holding a default. | Strongly supports leftward shifts and strongly opposes rightward shifts, showing the largest directional gap in the study. |
| GPT-5.5 Instant | — | |
Whatever the direction, the patterns shown in these tables are not trivial. With hundreds of millions of users in America alone, the political and social implications of AI influence are significant. But these are patterns of behavior, not fixed traits. Models can shift decisively between releases. If frontier models can land this far apart, the patterns observed here are products of design and thus can be changed by design. What's lacking is visibility. Tools like the Reception Graph can bridge the gap.
THE STAKES
AI systems are rapidly becoming cognitive infrastructure — companions, advisors, assistants, and sounding boards. If a model consistently nudges millions of users in one direction or another, that is power capable of redrawing the map.
This research demonstrates that such power can be made visible and measurable.
The data is clear: AI influence exists, but expressions vary widely. Some models push back, some encourage, yet they do not all lean in the same direction. None remain neutral all the time.
Even sibling models behave differently, suggesting these tendencies are guided less by foundational architecture than by post-training. In other words, they are products of choices. And users are shaped by choices they never see.
Like it or not, AI influence is here. But if it can be seen, it can be evaluated. Mixed-signal stress tests, for example, can surface ideological bias that would otherwise remain invisible.
Greater observability benefits everyone. Developers can identify problems before release, regulators can evaluate models on more objective grounds, and users can make informed choices about which AI to use. Transparency is not a luxury.